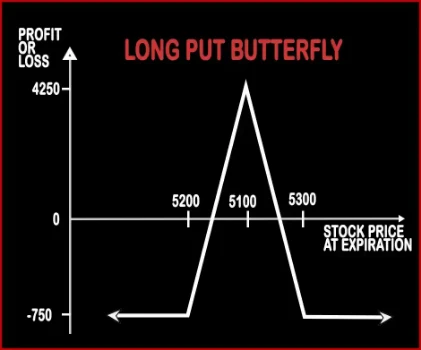
The Long Put Butterfly is a neutral strategy where a trader will be bearish on the volatility i.e. he thinks the market will have sideways kind of movement and will not rally sharply in either direction in the near future. This strategy involves sale of 2 ATM Put Options, buy 1 ITM and 1 OTM Put Option. The risk and reward are limited.
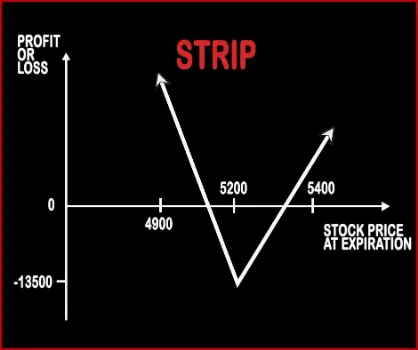
Strip Strategy is the opposite of Strap Strategy. When a trader is bearish on the market and bullish on volatility then he will implement this strategy by buying two ATM Put Options & one ATM Call Option, of the same strike price, expiry date & underlying asset. If the prices move downwards then this strategy will make more profits compared to short straddle because of the ..
Upper Breakeven Point = Strike Price of Highest Strike Long Put - Net Premium Paid, Lower Breakeven Point = Strike Price of Lowest Strike Long Put + Net Premium Paid
Upper Breakeven Point = Strike Price of Calls/Puts + Net Premium Paid, Lower Breakeven Point = Strike Price of Calls/Puts - (Net Premium Paid/2)
LONG PUT BUTTERFLY Vs STRIP - When & How to use ?
LONG PUT BUTTERFLY
STRIP
Market View
Neutral
Neutral
When to use?
The Long Put Butterfly is a neutral strategy where a trader will be bearish on the volatility i.e. he thinks the market will have sideways kind of movement and will not rally sharply in either direction in the near future.
When a trader is bearish on the market and bullish on volatility then he will implement this strategy.
Action
Buy 1 OTM Put, Sell 2 ATM Puts, Buy 1 ITM Put
Buy 1 ATM Call, Buy 2 ATM Puts
Breakeven Point
Upper Breakeven Point = Strike Price of Highest Strike Long Put - Net Premium Paid, Lower Breakeven Point = Strike Price of Lowest Strike Long Put + Net Premium Paid
Upper Breakeven Point = Strike Price of Calls/Puts + Net Premium Paid, Lower Breakeven Point = Strike Price of Calls/Puts - (Net Premium Paid/2)
LONG PUT BUTTERFLY Vs STRIP - Risk & Reward
LONG PUT BUTTERFLY
STRIP
Maximum Profit Scenario
Strike Price of Higher Strike Long Put - Strike Price of Short Put - Net Premium Paid - Commissions Paid
Price of Underlying - Strike Price of Calls - Net Premium Paid OR 2 x (Strike Price of Puts - Price of Underlying) - Net Premium Paid
Maximum Loss Scenario
When Price of Underlying <= Strike Price of Lower Strike Long Put OR Price of Underlying >= Strike Price of Higher Strike Long Put
Net Premium Paid + Commissions Paid
Risk
Limited
Limited
Reward
Limited
Unlimited
LONG PUT BUTTERFLY Vs STRIP - Strategy Pros & Cons
LONG PUT BUTTERFLY
STRIP
Similar Strategies
Iron Condors, Iron Butterfly
Strap, Short Put Ladder
Disadvantage
• Risk is higher than reward. • When the underlying price is in between the two breakeven points, time decay hurts the position.
Expensive., The share price must change significantly to generate profit., High Bid/Offer spread can have a negative influence on the position.
Advantages
• Limited maximum loss. • Unlimited profit potential, risk only limited to loss of premium. • Benefits from low volatility.
Profit is generated when the share price changes in any direction., Limited loss., The profit is potentially unlimited when share prices are moving.