Compare Strategies
| LONG PUT BUTTERFLY | SHORT PUT BUTTERFLY | |
|---|---|---|
|
|
|
| About Strategy |
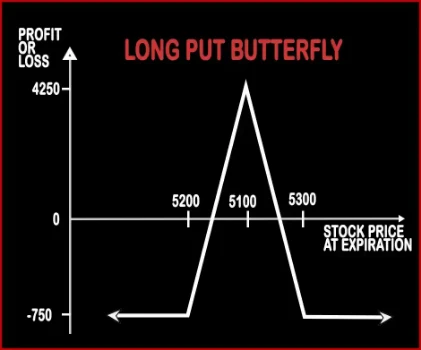
Long Put Butterfly Option StrategyThe Long Put Butterfly is a neutral strategy where a trader will be bearish on the volatility i.e. he thinks the market will have sideways kind of movement and will not rally sharply in either direction in the near future. This strategy involves sale of 2 ATM Put Options, buy 1 ITM and 1 OTM Put Option. The risk and reward are limited. |
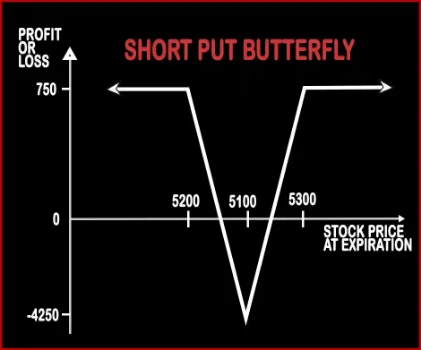
Short Put Butterfly Option StrategyIn Short Put Butterfly strategy, a trader is neutral in nature and expects the market to remain range bound in the near future. A trader will buy 2 ATM Put Options; sell 1 ITM & 1 OTM Put Options. Here risk and returns both are limited. Risk:< .. |
LONG PUT BUTTERFLY Vs SHORT PUT BUTTERFLY - Details
| LONG PUT BUTTERFLY | SHORT PUT BUTTERFLY | |
|---|---|---|
| Market View | Neutral | Neutral |
| Type (CE/PE) | PE (Put Option) | PE (Put Option) |
| Number Of Positions | 4 | 4 |
| Strategy Level | Advance | Advance |
| Reward Profile | Limited | Limited |
| Risk Profile | Limited | Limited |
| Breakeven Point | Upper Breakeven Point = Strike Price of Highest Strike Long Put - Net Premium Paid, Lower Breakeven Point = Strike Price of Lowest Strike Long Put + Net Premium Paid | Upper Breakeven Point = Strike Price of Highest Strike Short Put - Net Premium Received, Lower Breakeven Point = Strike Price of Lowest Strike Short Put + Net Premium Received |
LONG PUT BUTTERFLY Vs SHORT PUT BUTTERFLY - When & How to use ?
| LONG PUT BUTTERFLY | SHORT PUT BUTTERFLY | |
|---|---|---|
| Market View | Neutral | Neutral |
| When to use? | The Long Put Butterfly is a neutral strategy where a trader will be bearish on the volatility i.e. he thinks the market will have sideways kind of movement and will not rally sharply in either direction in the near future. | In Short Put Butterfly strategy, a trader is neutral in nature and expects the market to remain range bound in the near future. |
| Action | Buy 1 OTM Put, Sell 2 ATM Puts, Buy 1 ITM Put | Sell 1 ITM Put, Buy 2 ATM Put, Sell 1 OTM Put |
| Breakeven Point | Upper Breakeven Point = Strike Price of Highest Strike Long Put - Net Premium Paid, Lower Breakeven Point = Strike Price of Lowest Strike Long Put + Net Premium Paid | Upper Breakeven Point = Strike Price of Highest Strike Short Put - Net Premium Received, Lower Breakeven Point = Strike Price of Lowest Strike Short Put + Net Premium Received |
LONG PUT BUTTERFLY Vs SHORT PUT BUTTERFLY - Risk & Reward
| LONG PUT BUTTERFLY | SHORT PUT BUTTERFLY | |
|---|---|---|
| Maximum Profit Scenario | Strike Price of Higher Strike Long Put - Strike Price of Short Put - Net Premium Paid - Commissions Paid | Net Premium Received - Commissions Paid |
| Maximum Loss Scenario | When Price of Underlying <= Strike Price of Lower Strike Long Put OR Price of Underlying >= Strike Price of Higher Strike Long Put | Strike Price of Higher Strike Short Put - Strike Price of Long Put - Net Premium Received + Commissions Paid |
| Risk | Limited | Limited |
| Reward | Limited | Limited |
LONG PUT BUTTERFLY Vs SHORT PUT BUTTERFLY - Strategy Pros & Cons
| LONG PUT BUTTERFLY | SHORT PUT BUTTERFLY | |
|---|---|---|
| Similar Strategies | Iron Condors, Iron Butterfly | Short Condor, Reverse Iron Condor |
| Disadvantage | • Risk is higher than reward. • When the underlying price is in between the two breakeven points, time decay hurts the position. | • High risk strategy and may cause huge losses if the price of the underlying stocks falls steeply. • Higher profit is only possible when shares get close to expiration. |
| Advantages | • Limited maximum loss. • Unlimited profit potential, risk only limited to loss of premium. • Benefits from low volatility. | • Benefits from time decay. • Traders can earn more in a rising or range bound scenario. • Benefits from a surge in volatility. |