Compare Strategies
| STRIP | LONG PUT LADDER | |
|---|---|---|
|
|
|
| About Strategy |
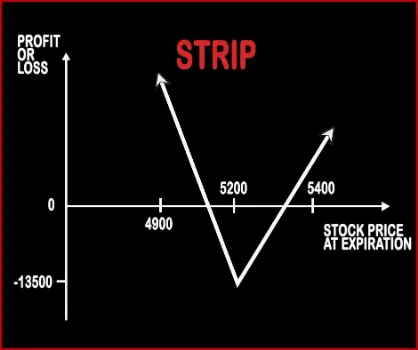
Strip Option StrategyStrip Strategy is the opposite of Strap Strategy. When a trader is bearish on the market and bullish on volatility then he will implement this strategy by buying two ATM Put Options & one ATM Call Option, of the same strike price, expiry date & underlying asset. If the prices move downwards then this strategy will make more profits compared to short straddle because of the |
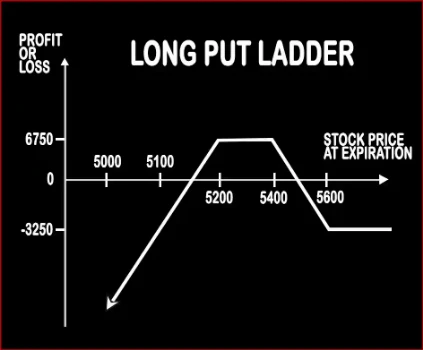
Long Put Ladder Option StrategyLong Put Ladder can be implemented when a trader is slightly bearish on the market and volatility. It involves buying of an ITM Put Option and sale of 1 ATM & 1 OTM Put Options. However, the risk associated with this strategy is unlimited and reward is limited. Risk:< .. |
STRIP Vs LONG PUT LADDER - Details
| STRIP | LONG PUT LADDER | |
|---|---|---|
| Market View | Neutral | Neutral |
| Type (CE/PE) | CE (Call Option) + PE (Put Option) | PE (Put Option) |
| Number Of Positions | 3 | 3 |
| Strategy Level | Beginners | Advance |
| Reward Profile | Unlimited | Limited |
| Risk Profile | Limited | Unlimited |
| Breakeven Point | Upper Breakeven Point = Strike Price of Calls/Puts + Net Premium Paid, Lower Breakeven Point = Strike Price of Calls/Puts - (Net Premium Paid/2) | Upper Breakeven Point = Strike Price of Long Put - Net Premium Paid, Lower Breakeven Point = Total Strike Prices of Short Puts - Strike Price of Long Put + Net Premium Paid |
STRIP Vs LONG PUT LADDER - When & How to use ?
| STRIP | LONG PUT LADDER | |
|---|---|---|
| Market View | Neutral | Neutral |
| When to use? | When a trader is bearish on the market and bullish on volatility then he will implement this strategy. | This Strategy can be implemented when a trader is slightly bearish on the market and volatility. |
| Action | Buy 1 ATM Call, Buy 2 ATM Puts | Buy 1 ITM Put, Sell 1 ATM Put, Sell 1 OTM Put |
| Breakeven Point | Upper Breakeven Point = Strike Price of Calls/Puts + Net Premium Paid, Lower Breakeven Point = Strike Price of Calls/Puts - (Net Premium Paid/2) | Upper Breakeven Point = Strike Price of Long Put - Net Premium Paid, Lower Breakeven Point = Total Strike Prices of Short Puts - Strike Price of Long Put + Net Premium Paid |
STRIP Vs LONG PUT LADDER - Risk & Reward
| STRIP | LONG PUT LADDER | |
|---|---|---|
| Maximum Profit Scenario | Price of Underlying - Strike Price of Calls - Net Premium Paid OR 2 x (Strike Price of Puts - Price of Underlying) - Net Premium Paid | Strike Price of Long Put - Strike Price of Higher Strike Short Put - Net Premium Paid - Commissions Paid |
| Maximum Loss Scenario | Net Premium Paid + Commissions Paid | When Price of Underlying < Total Strike Prices of Short Puts - Strike Price of Long Put + Net Premium Paid |
| Risk | Limited | Unlimited |
| Reward | Unlimited | Limited |
STRIP Vs LONG PUT LADDER - Strategy Pros & Cons
| STRIP | LONG PUT LADDER | |
|---|---|---|
| Similar Strategies | Strap, Short Put Ladder | Short Strangle (Sell Strangle), Short Straddle (Sell Straddle) |
| Disadvantage | Expensive., The share price must change significantly to generate profit., High Bid/Offer spread can have a negative influence on the position. | • Unlimited risk. • Margin required. |
| Advantages | Profit is generated when the share price changes in any direction., Limited loss., The profit is potentially unlimited when share prices are moving. | • Reduces capital outlay of bear put spread. • Wider maximum profit zone. • When there is decrease in implied volatility, this strategy can give profit. |