Compare Strategies
| DIAGONAL BEAR PUT SPREAD | LONG PUT LADDER | |
|---|---|---|
|
|
|
| About Strategy |
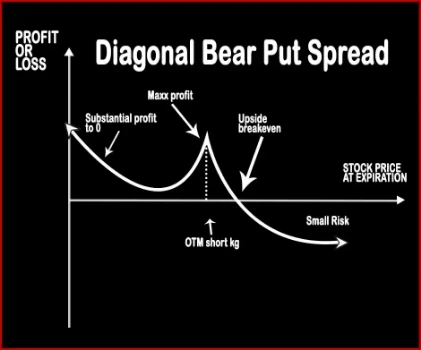
Diagonal Bear Put SpreadWhen the trader is neutral – bearish in the near-month and bearish in the mid-month, he will apply Diagonal Bear Put Spread. This strategy involves buying Mid-Month ITM Put Options and selling (short/write) equal number of Near-Month OTM Put Options, of the same underlying asset. This strategy bags limited rewards with limited risk. |
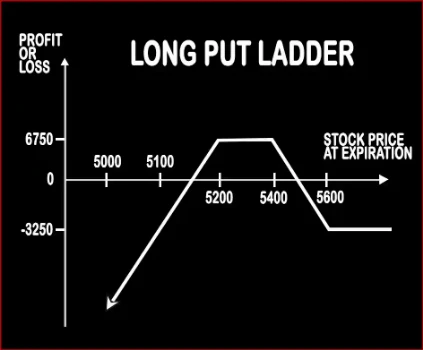
Long Put Ladder Option StrategyLong Put Ladder can be implemented when a trader is slightly bearish on the market and volatility. It involves buying of an ITM Put Option and sale of 1 ATM & 1 OTM Put Options. However, the risk associated with this strategy is unlimited and reward is limited. Risk:< .. |
DIAGONAL BEAR PUT SPREAD Vs LONG PUT LADDER - Details
| DIAGONAL BEAR PUT SPREAD | LONG PUT LADDER | |
|---|---|---|
| Market View | Bearish | Neutral |
| Type (CE/PE) | PE (Put Option) | PE (Put Option) |
| Number Of Positions | 2 | 3 |
| Strategy Level | Beginners | Advance |
| Reward Profile | Limited | Limited |
| Risk Profile | Limited | Unlimited |
| Breakeven Point | This is a dynamic trade with many possible scenarios and future trades, it is impossible to calculate a breakeven. | Upper Breakeven Point = Strike Price of Long Put - Net Premium Paid, Lower Breakeven Point = Total Strike Prices of Short Puts - Strike Price of Long Put + Net Premium Paid |
DIAGONAL BEAR PUT SPREAD Vs LONG PUT LADDER - When & How to use ?
| DIAGONAL BEAR PUT SPREAD | LONG PUT LADDER | |
|---|---|---|
| Market View | Bearish | Neutral |
| When to use? | When the trader is neutral – bearish in the near-month and bearish in the mid-month, he will apply Diagonal Bear Put Spread. This strategy involves buying Mid-Month ITM Put Options and selling (short/write) equal number of Near-Month OTM Put Options, of the same underlying asset | This Strategy can be implemented when a trader is slightly bearish on the market and volatility. |
| Action | Sell 1 Near-Month OTM Put Option, Buy 1 Mid-Month ITM Put Option | Buy 1 ITM Put, Sell 1 ATM Put, Sell 1 OTM Put |
| Breakeven Point | This is a dynamic trade with many possible scenarios and future trades, it is impossible to calculate a breakeven. | Upper Breakeven Point = Strike Price of Long Put - Net Premium Paid, Lower Breakeven Point = Total Strike Prices of Short Puts - Strike Price of Long Put + Net Premium Paid |
DIAGONAL BEAR PUT SPREAD Vs LONG PUT LADDER - Risk & Reward
| DIAGONAL BEAR PUT SPREAD | LONG PUT LADDER | |
|---|---|---|
| Maximum Profit Scenario | 'Premiums received - Initial premium to execute + Strike price - Stock Price on final month | Strike Price of Long Put - Strike Price of Higher Strike Short Put - Net Premium Paid - Commissions Paid |
| Maximum Loss Scenario | When the stock trades up above the long-term put strike price. | When Price of Underlying < Total Strike Prices of Short Puts - Strike Price of Long Put + Net Premium Paid |
| Risk | Limited | Unlimited |
| Reward | Limited | Limited |
DIAGONAL BEAR PUT SPREAD Vs LONG PUT LADDER - Strategy Pros & Cons
| DIAGONAL BEAR PUT SPREAD | LONG PUT LADDER | |
|---|---|---|
| Similar Strategies | Bear Put Spread and Bear Call Spread | Short Strangle (Sell Strangle), Short Straddle (Sell Straddle) |
| Disadvantage | Higher commissions due to additional trades. , Changes maximum profit potential of call or put spreads. | • Unlimited risk. • Margin required. |
| Advantages | The Risk is limited. | • Reduces capital outlay of bear put spread. • Wider maximum profit zone. • When there is decrease in implied volatility, this strategy can give profit. |