Technical Analysis: Uses, Indicators, Limitations, and Example
What is Technical Analysis?
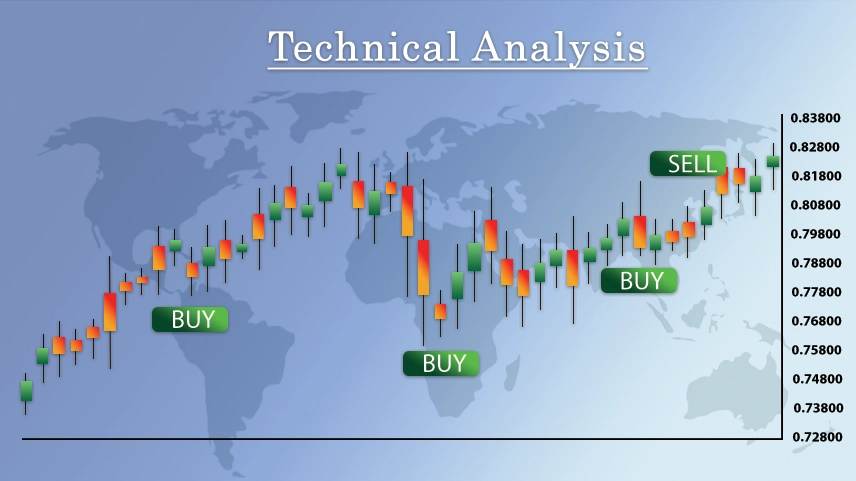
Technical analysis is a method of evaluating financial assets, such as stocks, currencies, or commodities, by analyzing historical price and volume data. It involves using charts, patterns, and various indicators to identify trends, market sentiment, and potential price movements. what is technical analysis in stock market? Technical analysts believe that past price and volume patterns can provide insights into future price behavior basics of technical analysis and help make informed trading decisions. It is primarily focused on price action and does not consider fundamental factors such as company financials or news events.

Use of Technical Analysis
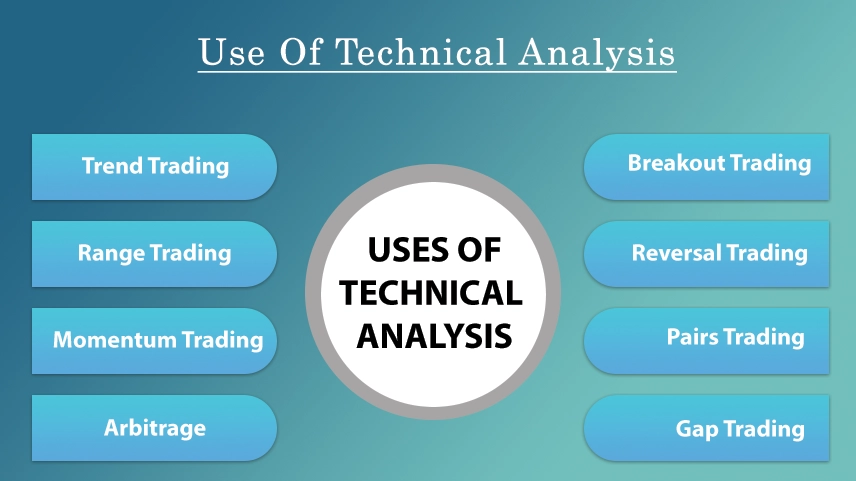
Technical analysis is used by traders and technical analysis is useful for investors to make decisions regarding buying, purpose of technical analysis selling, or holding financial assets. Here are some common uses of technical analysis, technical analysis uses:
1. Identifying trends: Technical analysis helps in identifying the direction of the market trend, whether it is upward (bullish), downward (bearish), or sideways. This information can guide traders to take positions that align with the prevailing trend.
2. Entry and exit points: Traders use technical analysis terms to determine favorable entry points to initiate a trade or investment and exit points to maximize profits or limit losses. This is done by analyzing support and resistance levels, chart patterns, and indicators.

3. Pattern recognition: Technical analysis involves recognizing chart patterns, such as head and shoulders, double tops or bottoms, triangles, and flags. These patterns can indicate potential trend reversals or continuation, providing traders with opportunities to take appropriate actions.
4. Indicators and oscillators: Technical analysis incorporates a wide range of indicators and oscillators, such as moving averages, relative strength index (RSI), MACD (Moving Average Convergence Divergence), and stochastics. These tools help in assessing the strength, momentum, and overbought/oversold conditions of an asset, aiding in decision-making.
5. Risk management: Technical analysis plays a role in risk management by setting stop-loss levels, which are predetermined price points at which traders exit a trade to limit potential losses. This helps in managing risk and protecting capital.
6. Backtesting and strategy development: Traders often use historical price data to backtest their trading strategies based on role of technical analysis. By assessing the performance of strategies in different market conditions, they can refine and develop trading plans with higher probabilities of success.
Technical Analysis Indicators
There are numerous technical analysis indicators used by traders and analysts to gain insights into price trends, momentum, volatility, and other market factors. Here are some commonly used technical analysis indicators:
1. Moving Averages (MA): Moving averages help identify the average price over a specific period. The most popular types are Simple Moving Average (SMA) and Exponential Moving Average (EMA).
2. The Relative Strength Index (RSI): helps assess the velocity and magnitude of price changes in a simplified manner. It provides insights into the speed at which prices are moving and the extent of those movements. It indicates overbought or oversold conditions, and helping to identify potential trend reversals.
3. MACD (Moving Average Convergence Divergence): MACD is used to identify changes in momentum, trend direction, and potential buy/sell signals. It consists of MACD line, signal line, and histogram.
4. Bollinger Bands: Bollinger Bands show the volatility of an asset. They consist of a moving average and upper/lower bands that represent standard deviations from the average.
5. Stochastic Oscillator: Stochastic oscillator indicates overbought or oversold conditions by comparing the closing price of an asset to its price range over a specific period.
6. Fibonacci Retracement: Fibonacci retracement uses horizontal lines to identify potential support and resistance levels based on ratios derived from the Fibonacci sequence.
7. Average True Range (ATR): ATR measures the volatility of an asset by calculating the average range between high and low prices over a specific period.
8. Ichimoku Cloud: Ichimoku cloud is a comprehensive indicator that provides insights into trend direction, support/resistance levels, and potential buy/sell signals.
9. Volume: Volume is not an indicator per se but is used to confirm price trends and identify significant market movements. High volume often accompanies strong price action.
Limitations of Technical Analysis
Technical analysis has several limitations that traders and analysts should be aware of. Firstly, common technical analysis indicators are subjective, as it relies on interpretations of patterns and indicators, which can vary among individuals. Moreover, it primarily focuses on historical price and volume data, assuming that past patterns will repeat. However, market dynamics can change, rendering some patterns unreliable. Additionally, technical analysis disregards fundamental factors such as company financials and news events, which can have a significant impact on asset prices. False signals and lagging indicators are common challenges, as indicators may generate inaccurate signals or lag behind market movements. Furthermore, technical analysis cannot predict market direction with certainty, and market manipulation can distort normal market behavior. To mitigate these limitations of the analysis, it is advisable to complement all technical analysis indicators with other forms of analysis and consider a broader range of factors when making trading decisions.
Technical Analysis Example
A technical analyst might examine the stock's price chart and apply various indicators to gain insights and make informed decisions.
They could start by drawing trendlines to identify the stock's primary trend. Next, they might use moving averages, such as the 50-day and 200-day moving averages, to identify potential support and resistance levels. If the stock consistently bounces off the 50-day moving average during pullbacks, it may suggest a strong support level.
Additionally, the analyst might use oscillators like the Relative Strength Index (RSI) to gauge whether the stock is overbought or oversold. If the RSI indicates an overbought condition (above 70), it may suggest a potential reversal or correction in the price.
Chart patterns can also be analyzed. For example, the analyst might look for bullish patterns like a cup and handle or a double bottom formation, technical analysis limitations, which could indicate a potential bullish trend continuation. By combining these indicators, the limitations of the analysis the analyst can generate trading signals. For instance, if the stock breaks above a resistance level on high volume and the RSI indicates a bullish signal, it might provide a buy signal. Conversely, if the stock breaks below a support level with increasing volume and the RSI signals a bearish condition, it might generate a sell signal.
0 comments