Stochastic Oscillator: Function, Formula, Limitations, and Conclusion
What is a Stochastic Oscillator
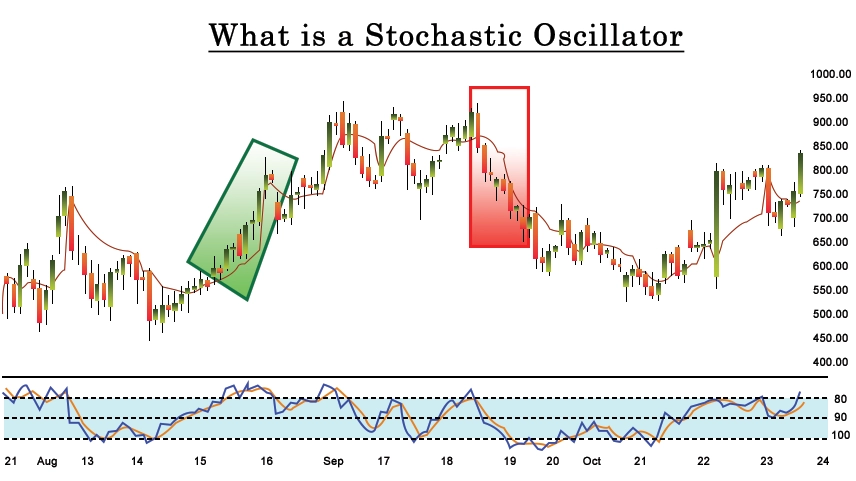
The Stochastic Oscillator is a technical analysis tool used in the field of stock trading, forex trading, and other financial markets. It is designed to help traders identify potential reversal points in price trends and to gauge the overbought or oversold conditions of an asset.
The Stochastic Oscillator is a momentum indicator employed in technical analysis. It compares a specific closing price of a financial asset with a range of its prices over a defined timeframe. This comparison gauges the relative strength of the asset's recent price movement. To lessen its sensitivity to rapid market shifts, one can modify the time period or apply a moving average to the calculated value. The oscillator produces values within a confined range of 0 to 100. It serves to generate trading signals for identifying potential overbought (highly-priced) and oversold (underpriced) conditions in the market. The Stochastic Oscillator is based on the premise that as an asset's price trends upwards, its closing price tends to close near the high of the trading range, and when the price trends downwards, it tends to close near the low of the trading range. The Stochastic Oscillator consists of two lines: the %K line and the %D line.

How it Works
The stochastic oscillator strategy operates by evaluating the relationship between a recent closing price of an asset and its price range over a specified period. Here's a simple breakdown of the process:
1. Calculate the Range: Determine the highest high and the lowest low prices over a defined number of periods. This range provides context for the current price's position within recent trading activity.
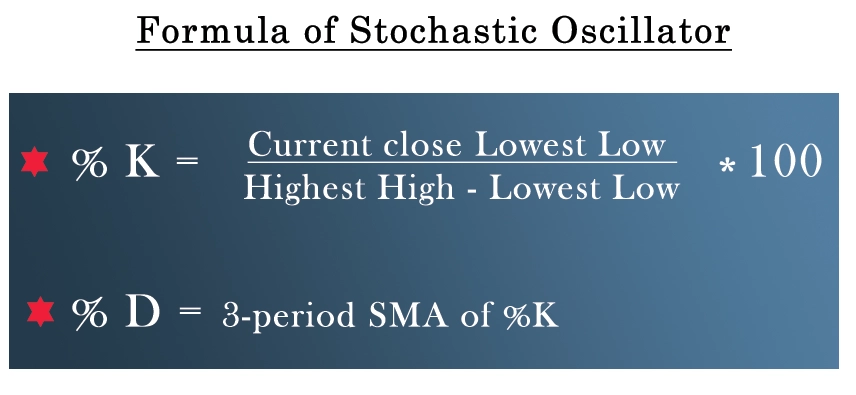
2. Calculate %K: Using the current closing price, the lowest low, and the highest high, compute the %K value using the formula for stochastic oscillator
%K is calculated by taking the current closing price, subtracting the lowest low, dividing by the difference between the highest high and lowest low, and then multiplying by 100.
This value represents the percentage of the range within which the closing price falls. It measures the relative position of the closing price in relation to recent price activity.
3. Apply Smoothing (%D Line): To reduce the volatility of the %K line, a moving average is often applied. This moving average is called the %D line. It's typically calculated over a specified number of periods. The most common setting is to use a simple moving average over three periods.
4. Interpretation of Levels:
• Overbought Level: Traditionally set at 70, a %K value above this level suggests that the asset's price might be overextended or reaching a peak. Traders consider this a potential signal for a price reversal or pullback.
• Oversold Level: Typically set at 30, a %K value below this level indicates that the asset's price might have declined excessively and could be due for a rebound or price increase.
5. Generating Signals:
• Bullish Signal: When the %K line crosses above the %D line, it's seen as a bullish signal. This suggests potential upward momentum and a possible buying opportunity.
• Bearish Signal: If the %K line crosses below the %D line, it's considered a bearish signal. This implies potential downward momentum and a possible selling opportunity.
6. Divergence: Traders also watch for divergence between the Stochastic Oscillator and the price movement. If the oscillator makes higher highs or lower lows while the price does the opposite, it can indicate potential trend reversal or weakening momentum.
Formula
The Stochastic Oscillator's calculation involves using this formula: stochastic oscillator k and d
1. Calculate %K:
%K is calculated by taking the current closing price, subtracting the lowest low, dividing it by the difference between the highest high and lowest low, and then multiplying the result by 100.
• Current Close: The closing price of the current period.
• Lowest Low: The lowest price traded during a specified number of previous periods.
• Highest High: The highest price traded during the same specified number of previous periods.

2. Apply Smoothing (%D Line):
%D = Moving Average of %K
The most common settings for the Stochastic Oscillator are using a 14-period calculation for %K (which means looking at the last 14 periods) and applying a 3-period simple moving average to %K to calculate %D.
Limitations
The stochastic oscillator alert, while a valuable tool in technical analysis, is not without its limitations. One of its primary drawbacks is its susceptibility to generating false signals. These instances occur when the indicator suggests a certain trading action, but the actual price movement fails to materialize accordingly. This phenomenon can lead to misguided trading decisions and potential losses. This tendency is especially pronounced during periods of market volatility, where erratic price swings can trigger unreliable signals. Traders have found ways to mitigate this limitation by incorporating trend analysis as a filter. By only considering signals that align with the prevailing price trend, traders aim to enhance the accuracy of the signals and minimize the impact of false readings. Despite its limitations, the best intraday Stochastic Oscillator remains a useful tool when integrated into a broader analytical framework that takes into account market conditions, trend direction, and additional indicators.
Conclusion
A Stochastic Oscillator is a widely used momentum indicator in technical analysis that helps traders identify potential reversals and overbought/oversold conditions in the market. However, it comes with several limitations that traders need to be mindful of. The most prominent limitation is its tendency to generate false signals, where the indicator suggests a trade that doesn't align with actual price movement, leading to potential losses. This issue is more pronounced in volatile markets. To address this, traders often incorporate trend analysis as a filter, considering signals only if they coincide with the prevailing price trend. By doing so, they aim to increase the accuracy of signals and navigate around the limitations of the Stochastic Oscillator. Despite these shortcomings, the Stochastic Oscillator remains a valuable tool when used in conjunction with other analysis techniques and a comprehensive trading strategy.
0 comments