Qstick Indicator – Formula, Calculation, and Limitations
What is a Qstick indicator?
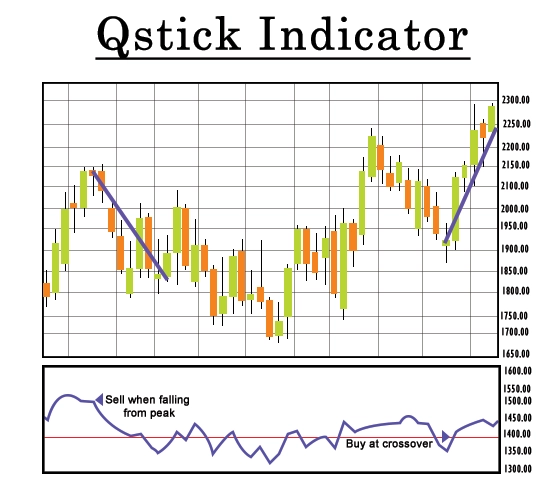
The Qstick indicator is a technical analysis tool used in financial markets to assess the strength and direction of a price trend. It was developed by Tushar Chande and is often used in conjunction with other indicators to make trading decisions.
The Qstick indicator measures the difference between the opening and closing prices of a given time period, similar to a candlestick chart. It calculates the net difference and then smoothes it using a moving average. The resulting value represents the strength of the price trend.

Formula for calculating the Qstick indicator
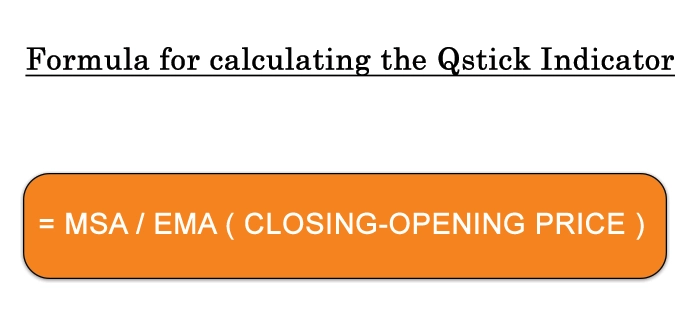
The formula for calculating the Qstick indicator is as follows:
Qstick = (Close - Open) + (Close - Open) + ... + (Close - Open) / N
Where:
- Close represents the closing price for each period
- Open represents the opening price for each period
- N represents the number of time periods considered when calculating the Qstick indicator.
The Qstick indicator generates positive values when the closing price is higher than the opening price over a given period, indicating bullishness. Conversely, it generates negative values when the closing price is lower than the opening price, indicating bearishness.
Traders use the Qstick indicator to identify trends, confirm breakouts or reversals, and gauge the overall market sentiment. Positive values suggest bullishness, while negative values suggest bearishness. The magnitude of the values can also indicate the strength of the trend.

Calculation of the Qstick Indicator
To calculate the Qstick indicator, you find the average difference between the closing and opening prices over a certain number of time periods by using a moving average.
Here's the step-by-step process for calculating the Qstick indicator:
1. Determine the number of periods (n) for which you want to calculate the Qstick indicator.
2. Calculate the difference between the closing price (Close) and the opening price (Open) for each period.
Difference = Close - Open
3. Sum up the differences over the specified number of periods (n).
Sum = Difference of Period 1 + Difference of Period 2 + ... + Difference of Period n
4. Divide the sum by the number of periods (n) to calculate the average difference.
Average Difference = Sum / n
5. Repeat steps 2-4 for each subsequent period, adjusting the calculation based on the rolling window of the specified number of periods.
6. The resulting values are the Qstick indicator values for each period, representing the average difference between closing and opening prices over the specified number of periods.
You can use a moving average function or spreadsheet software to simplify the calculation process. The specific implementation may vary depending on the charting platform or software you are using.
Remember that the Qstick indicator is just one tool among many in technical analysis. It is advisable to use it in conjunction with other indicators, analysis techniques, and your qstick indicator strategy to make well-informed decisions.
Limitations of Using the QStick Indicator
While the Qstick indicator can provide insights into market trends and buying/selling pressure, it's important to be aware of its limitations, limitations of qt Here are some potential limitations of using the Qstick indicator:
1. Lagging Indicator: The Qstick indicator relies on past price data, which means it is a lagging indicator. It may not provide real-time or immediate signals for entering or exiting trades. Traders should be cautious of potential delays in signal generation.
2. Sensitivity to Period Selection: The Qstick indicator's effectiveness can be influenced by the choice of the number of periods used in the calculation. Different periods can produce varying results, leading to different interpretations of the indicator. Traders should test and optimize the indicator with different period values to find what works best for the specific market and timeframe they are analyzing.
3. Lack of Confirmation: While the Qstick indicator can indicate buying or selling pressure, it should ideally be used in combination with other indicators or basic technical analysis indicators techniques to confirm trends or generate signals. Relying solely on the Qstick indicator may not provide a comprehensive view of market conditions.
4. False Signals: Like any technical indicator, the Qstick indicator is not immune to generating false signals. There may be instances where the indicator produces misleading or contradictory signals, leading to potential losses if relied upon blindly. Traders should exercise caution and consider using additional confirmation tools to reduce the likelihood of false signals.
5. Market Conditions: The effectiveness of the Qstick indicator can vary depending on market conditions. It may perform differently in trending markets compared to range-bound or choppy markets. Traders should be mindful of adapting their strategies and analysis techniques based on prevailing market conditions.
6. Subjectivity: The interpretation of Qstick indicator values can be subjective. Traders may have different thresholds or criteria for determining bullish or bearish conditions based on their trading style or preferences. It's important to define clear rules and guidelines for interpreting Qstick indicator signals to maintain consistency in trading decisions.
Conclusion
The Qstick indicator, created by Tushar Chande, is a tool used in technical analysis to recognize patterns and determine the strength of buying or selling activity in the market. Its purpose is to help traders identify trends and make informed decisions based on market pressure. However, it is important to recognize that no single indicator can provide absolute reliability in making trading decisions. The Qstick indicator, like any other indicator, has limitations.
It relies on past price data and does not guarantee accurate predictions of future price movements. Market conditions and external factors can influence price behavior, making it challenging to rely solely on historical data. Therefore, it is advisable to use the Qstick indicator as part of a broader analysis framework that includes other indicators and analysis techniques.
The effectiveness and reliability of the Qstick indicator can vary depending on market conditions and the chosen parameters. It is essential to adapt strategies and indicators to suit the current market environment. Additionally, risk management practices should be integrated into trading strategies to mitigate potential losses.
By understanding the limitations of the Qstick indicator and combining it with other indicators, traders can gain a more comprehensive understanding of market trends and make more informed trading decisions. Ultimately, successful trading requires a holistic approach that considers multiple factors and incorporates proper risk management techniques.
0 comments