Parabolic SAR Indicator: How it works, Formula, Uses
What is Parabolic SAR Indicator
The Parabolic SAR (Stop and Reverse) is a technical analysis indicator primarily used to determine potential reversal points in the price direction of an asset. understanding parabolic sar, It was developed by J. Welles Wilder Jr., and it's often used by traders to set trailing stop-loss orders.
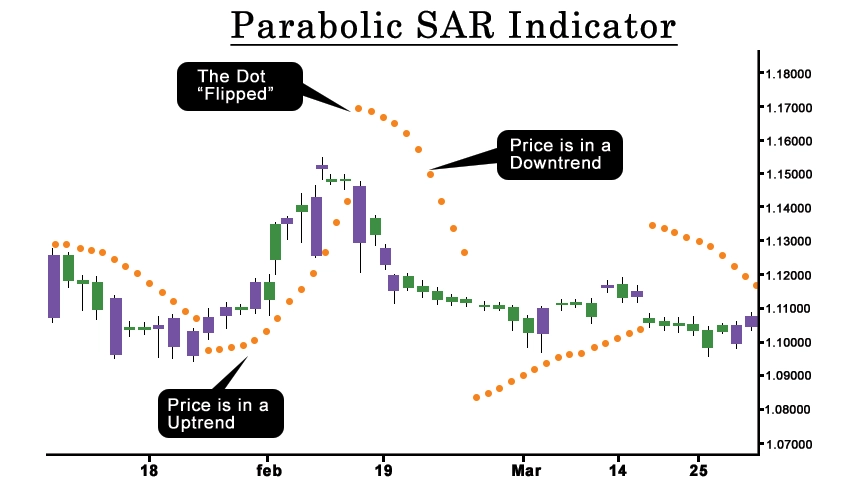
The Parabolic SAR (Stop and Reverse) is a technical analysis indicator used primarily to identify potential reversal points in the price direction of an asset. It visually appears as a series of dots either above or below the price chart, indicating potential trend changes.
The Parabolic SAR calculates its values based on the prior SAR value, the current extreme (highest high or lowest low), and an acceleration factor. This factor adjusts the SAR value based on recent price movements, allowing it to trail the price action closely.

How it Works
Certainly, here's how the Parabolic SAR indicator works, broken down into points:
1. Calculation: The Parabolic sar parabolic indicator is calculated using the previous SAR value, the current extreme price (highest high or lowest low), and an acceleration factor. The formula is somewhat complex, but essentially adjusts the SAR value based on recent price movements.
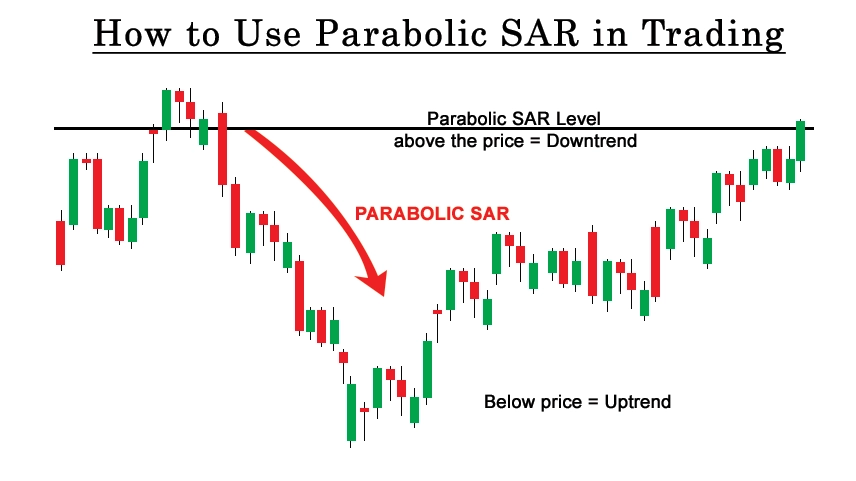
2. Trend Identification: The indicator helps identify the direction of the prevailing trend. When the dots are below the price, it indicates an uptrend, while dots above the price suggest a downtrend.
3. Reversal Signals: The Parabolic SAR provides signals for potential trend reversals. A reversal occurs when the dots switch positions relative to the price. For instance, a shift from dots below the price to dots above it suggests a reversal from bullish to bearish sentiment, and vice versa.
4. Trailing Stop-Loss Placement: Traders often use the Parabolic SAR to set trailing stop-loss orders. In an uptrend, the SAR dots act as support levels, moving up as the trend progresses. Conversely, in a downtrend, the SAR dots serve as resistance levels, moving down as the trend continues. This trailing stop-loss mechanism helps traders lock in profits while staying in a trade as long as the trend persists.
5. Acceleration Factor: The acceleration factor is a parameter that determines the rate at which the SAR moves in response to price changes. It typically starts at a certain value and increases over time, potentially allowing the SAR to catch up with rapidly moving trends.
6. Confirmation with Other Indicators: Traders often use the Parabolic SAR in conjunction with other technical indicators or chart patterns to confirm signals and avoid false signals. Combining it with indicators such as Moving Averages or Relative Strength Index (RSI) can enhance its effectiveness.
7. Risk Management: As with any trading strategy, parabolic sar indicator strategy risk management is crucial when using the Parabolic SAR. Traders should consider factors such as position sizing, entry and exit points, and overall market conditions to mitigate risks and optimize returns.
8. Adaptation to Market Conditions: The Parabolic SAR can adapt to different market conditions, but it may perform better in trending markets compared to ranging or sideways markets. Traders should be aware of market dynamics and adjust their strategies accordingly.
Formula
The Parabolic SAR (Stop and Reverse) indicator is calculated using the following formula:
1. Initial SAR: To initialize the calculation, you start with an initial SAR value. This value could be the highest high or lowest low observed in a series of preceding periods.
2. Extreme Point (EP): This is the highest high or lowest low observed in the current trend, whichever is applicable.
3. Acceleration Factor (AF): This is a constant value that increases each time a new EP is reached. The typical starting value for AF is 0.02, and it can increase by 0.02 for each new EP, usually up to a maximum value, often set at 0.20.
The formula to calculate Parabolic SAR for each period is as follows: parabolic sar indicator formula
• SAR [Current Period] = SAR[Previous Period] + AF * (EP - SAR[Previous Period])
Where:
• SAR [Current Period] is the Parabolic SAR value for the current period.
• SAR [Previous Period] is the Parabolic SAR value for the previous period.
• AF is the acceleration factor.
• EP is the extreme point (highest high for uptrends, lowest low for downtrends) observed in the current trend.
Additionally, the direction of the trend (whether it's bullish or bearish) determines how EP is calculated:
• For an uptrend: EP is the highest high observed in the current trend.
• For a downtrend: EP is the lowest low observed in the current trend.
This process continues for each period, with the SAR value recalculated based on the previous SAR value, the current EP, and the acceleration factor.
How to use Parabolic SAR in Trading
Using the Parabolic SAR (Stop and Reverse) indicator in trading involves several steps to identify potential trends, reversals, and trade entry/exit points. use of parabolic sar indicator Here's a guide on how to use the Parabolic SAR effectively in trading:

1. Identify the Trend: The first step is to determine the direction of the prevailing trend using the Parabolic SAR. When the dots are below the price, it indicates an uptrend, while dots above the price suggest a downtrend. It's essential to trade in the direction of the trend to increase the likelihood of success.
2. Confirm with Other Indicators: While the Parabolic SAR can provide valuable insights into the trend direction, it's often beneficial to confirm its signals with other technical indicators or chart patterns. Common indicators for confirmation include Moving Averages, Relative Strength Index (RSI), and MACD (Moving Average Convergence Divergence).
3. Identify Potential Reversals: The Parabolic SAR can also signal potential trend reversals. A reversal occurs when the dots switch positions relative to the price. For example, a shift from dots below the price to dots above it suggests a reversal from bullish to bearish sentiment, and vice versa. Traders can use these reversal signals to consider closing existing positions or potentially entering new trades in the opposite direction.
4. Set Trailing Stop-Loss Orders: One of the primary uses of the Parabolic SAR is to set trailing stop-loss orders to protect profits and manage risk. In an uptrend, the SAR dots act as support levels, moving up as the trend progresses. Conversely, in a downtrend, the sar parabolic dots serve as resistance levels, moving down as the trend continues. Traders can adjust their stop-loss levels based on the movement of the parabolic sar dots, allowing them to lock in profits while staying in a trade as long as the trend persists.
5. Consider Market Conditions: While the Parabolic SAR can be effective in trending markets, it may produce false signals or generate choppy signals in ranging or sideways markets. Traders should consider overall market conditions and adjust their trading strategies accordingly. In volatile markets, the acceleration factor of the parabolic sar indicator accuracy may need adjustment to avoid excessive whipsaws.
6. Implement Risk Management: As with any trading strategy, risk management is crucial when using the Parabolic SAR. Traders should determine appropriate position sizes, set stop-loss levels, and establish profit targets before entering trade. Additionally, traders should avoid over-leveraging and maintain a disciplined approach to trading.
7. Backtest and Practice: Before using the Parabolic SAR in live trading, it's essential to backtest the sar parabolic strategy on historical data to evaluate its effectiveness. Additionally, practicing with a demo account can help traders gain familiarity with how the indicator behaves in different market conditions and refine their trading approach.
Conclusion
In conclusion, the Parabolic SAR indicator is a valuable tool for traders seeking to analyze trends and make informed decisions in financial markets. With its straightforward formula and intuitive functionality, it serves as a reliable aid in identifying potential entry and exit points. Whether used alone or in combination with other technical indicators, understanding the Parabolic SAR can enhance your trading strategy and help you navigate market fluctuations more effectively.
0 comments