Fibonacci Retracement: Formula, Calculations, and Limitations
What is Fibonacci Retracement
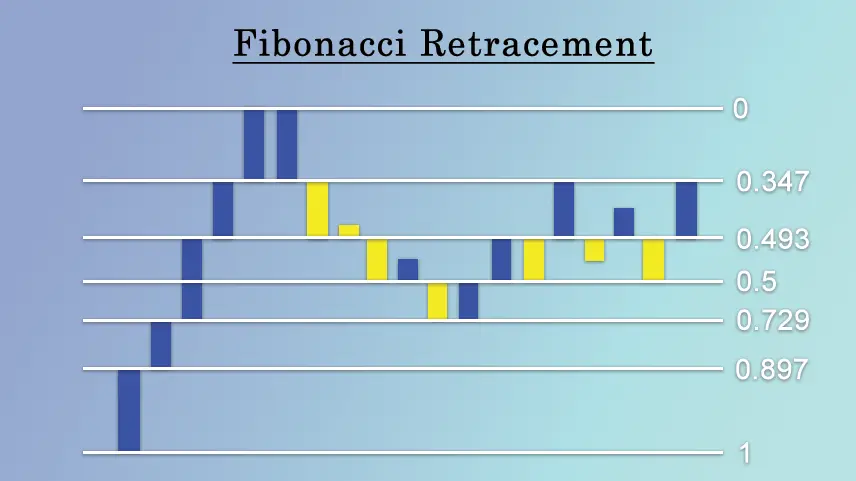
Fibonacci retracement helps traders find potential support and resistance on charts. It relies on the Fibonacci sequence, where each number is the sum of the two before it. In trading, Fibonacci retracement levels are typically drawn by connecting a low point to a high point on a price chart and then dividing the vertical distance by key Fibonacci ratios—commonly 23.6%, 38.2%, 50%, 61.8%, and 78.6%.
Traders use these retracement levels to anticipate potential reversal or pullback zones in the price of a financial instrument. The idea is that these levels may act as areas of interest where the price could bounce or stall, providing traders with insights for making decisions on entry, exit, and risk management.
In essence, fibonacci retracement accuracy is a tool that helps traders identify possible levels where a trend might change direction or experience a significant pullback, based on the historical relationships between Fibonacci ratios and market movements.
What is the Formula of Fibonacci retracement
The formula for calculating Fibonacci retracement levels is as follows:
Retracement Level=High−(High−Low) ×Fibonacci Ratio
• High is the highest point reached by the price.
• Low is the lowest point reached by the price.
• Fibonacci RatioFibonacci Ratio is a key Fibonacci ratio expressed as a decimal.
The common Fibonacci ratios used for retracement levels are:
• 23.6% (0.236)
• 38.2% (0.382)
• 50% (0.5)
• 61.8% (0.618)
• 78.6% (0.786)
Traders use these retracement levels to identify potential areas of support and resistance in a price chart. The Fibonacci retracement tool is widely available in charting software, simplifying the process for traders to apply these levels to analyze market trends.
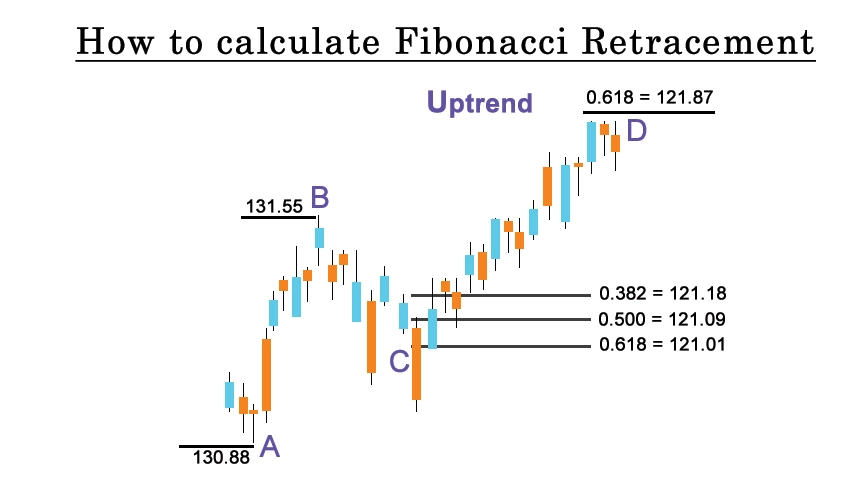
How to Calculate Fibonacci Retracement
Calculating Fibonacci retracement levels involves a few simple steps. Here's a step-by-step guide:
1. Identify the High and Low Points:
• High: Determine the highest point reached by the price.
• Low: Identify the lowest point reached by the price.
2. Calculate the Price Range:
• Subtract the Low from the High to find the total price range.
Price Range=High−LowPrice Range=High−Low
3. Apply Fibonacci Ratios:
• Choose the Fibonacci retracement ratios you want to use. Common ratios include 23.6%, 38.2%, 50%, 61.8%, and 78.6%.
4. Calculate Fibonacci Retracement Levels:
• For each chosen ratio, use the following formula:
Retracement Level=High−(Price Range×Fibonacci Ratio)Retracement Level=High−(Price Range×Fibonacci Ratio)
Substitute the values for High, Low, Price Range, and Fibonacci Ratio into the formula for each retracement level.
5. Plot the Levels on the Chart:
• Once you have calculated the retracement levels, plot them on the price chart. Most trading platforms and charting software have tools to automatically apply Fibonacci retracement levels.
6. Analyze Potential Support and Resistance:
• The retracement levels act as potential support and resistance areas. Traders use these levels to make decisions on entry points, exits, and setting stop-loss orders.
Limitations of Fibonacci Retracement
Fibonacci retracement, while a popular tool in technical analysis, has limitations. Its subjectivity, as the identification of high and low points can vary, introduces interpretation challenges. fibonacci retracement all levels tool is not infallible and may not consistently predict price reversals or support/resistance levels. Relying solely on fibonacci retracement extension without considering other factors can lead to misguided trading decisions. The risk of becoming a self-fulfilling prophecy exists, as mass trader attention to the same fibonacci retracement day trading levels may influence market behavior. Additionally, market noise, lack of a scientific basis, and dependence on timeframes contribute to its limitations. Traders should use Fibonacci retracement cautiously, integrating it with other analyses and risk management strategies for a more comprehensive approach.
0 comments