Breadth Indicator: Calculation, Investor uses, and Limitations
What is Breadth Indicator
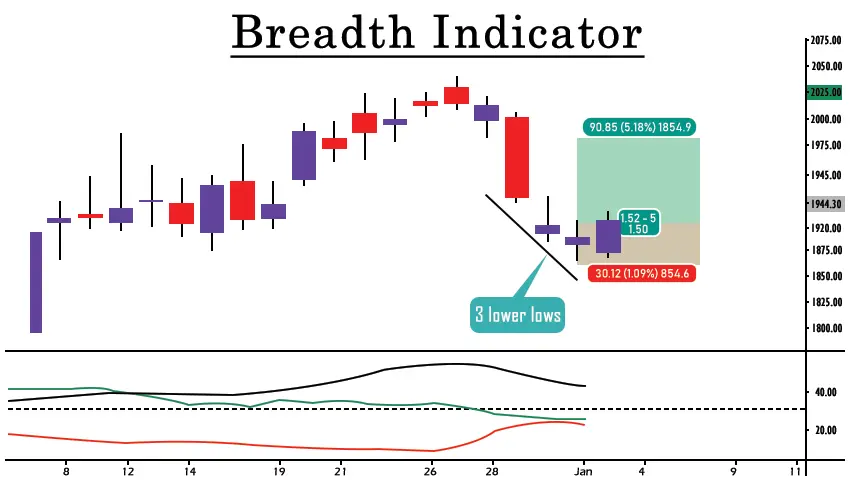
A breadth indicator is a type of technical analysis tool used by traders and investors to measure the breadth or depth of market participation by examining the number of advancing and declining assets within a specific market or index. These indicators help assess the overall health of the market by providing insights into the level of participation among individual stocks or securities. breadth indicators in technical analysis can include metrics such as the number of advancing versus declining stocks, the volume of trading activity in advancing versus declining stocks, breadth indicators explained the number of stocks making new highs or lows, and various other measures of market breadth. By analyzing breadth indicators, traders can confirm the strength of a market trend, identify potential trend reversals, and gauge investor sentiment. Examples of breadth indicators include the Advance-Decline Line (AD Line), Advance-Decline Ratio, New Highs-Lows Index, and Up-Down Volume Ratio.

How to Calculate Breadth Indicators
The calculation of breadth indicators varies depending on the specific indicator being used. Breadth indicator calculator However, I'll provide a general overview of how some common is a breadth indicator are calculated:
1. Advance-Decline Line (AD Line):
• Start with an initial value for the AD line, often set to zero.
• For each trading day:
• Calculate the difference between the number of advancing stocks and declining stocks.
• Add this difference to the previous day's AD line value.
• The resulting value is the AD line.
2. Advance-Decline Ratio:
• Count the number of advancing stocks and the number of declining stocks.
• Divide how many stocks are going up by how many are going down.
• The resulting ratio indicates market breadth.
3. New Highs-Lows Index:
• Count the number or stocks making new highs & the number of stocks making new lows.
• Take away the number of stocks hitting new lows from the number of stocks hitting new highs.
• The resulting value represents market breadth.
4. Up-Down Volume Ratio:
• Calculate the total volume of advancing stocks and the total volume of declining stocks.
• Divide the volume of advancing stocks by the volume of declining stocks.
• The resulting ratio indicates market breadth based on volume.
How Investor use Breadth indicators?
Investors use breadth indicators the participation level of stocks within a market index or sector. By assessing how many stocks are advancing or declining, investors can understand the breadth of market movements beyond just the index's price.
For example, if a stock market index is rising, but breadth indicators show that only a few stocks are driving the gains while the majority are declining, it might indicate a weaker foundation for the uptrend. Conversely, if a large number of stocks are advancing alongside the index, it suggests a healthier and more sustainable market rally.
Breadth indicators also help investors identify potential market reversals. For instance, if the market index is making new highs, but breadth indicators show a decreasing number of advancing stocks, it could signal that the market's strength is waning, potentially indicating an impending reversal.
Breadth indicators assist investors in diversification decisions. By analyzing the breadth of participation across different sectors or industries, investors can identify areas of strength or weakness within the market. This information helps them allocate their investments strategically, focusing on sectors with broad-based strength and avoiding those with declining participation.
Limitations of breadth indicators
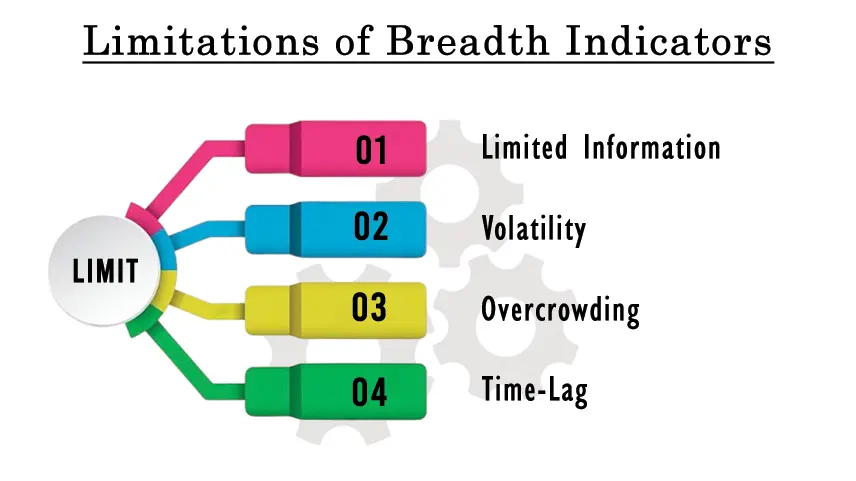
While breadth indicators offer valuable insights into market dynamics, they also have some limitations: limitations of indicators.
1. Lagging Nature: Breadth indicators are based on historical data and tend to lag behind current market conditions. By the time a breadth indicator signals a change in market breadth, the market may have already moved significantly, leading to potential missed opportunities or delayed reactions.
2. No Context on Magnitude: Breadth indicators provide information on the number of advancing and declining stocks but do not offer insights into the magnitude of price movements. A stock with a small price change may carry the same weight as one with a significant price change, potentially skewing the interpretation of market breadth.
3. Not Standalone Signals: Breadth indicators are most effective when used in conjunction with other technical and fundamental analysis tools. Relying solely on breadth indicators for investment decisions may overlook important factors such as fundamental strength or market sentiment.
4. Vulnerable to Market Manipulation: In thinly traded markets or during periods of heightened volatility, breadth indicators may be susceptible to manipulation or distortions caused by a small number of influential stocks or traders.
5. Doesn't Consider Market Capitalization: Breadth indicators treat all stocks equally, regardless of their market capitalization. Therefore, a few large-cap stocks may disproportionately influence the indicator's readings, potentially masking underlying weaknesses or strengths in smaller-cap stocks.

6. Not Applicable in All Markets: Breadth indicators may not be as effective in markets with limited breadth, such as narrow sector-focused indices or markets dominated by a few large-cap stocks. In such cases, breadth indicators may provide less meaningful insights into market dynamics.
Conclusion
In conclusion, breadth indicators are essential tools for investors to gauge the overall health of the market and identify potential trends. By calculating the number of advancing and declining stocks, investors can assess market sentiment and make informed decisions. However, it's crucial to recognize their limitations, such as the potential for false signals and their reliance on market breadth rather than individual stock performance. Despite these drawbacks, breadth indicators remain valuable for investors seeking a broader perspective on market dynamics.
0 comments