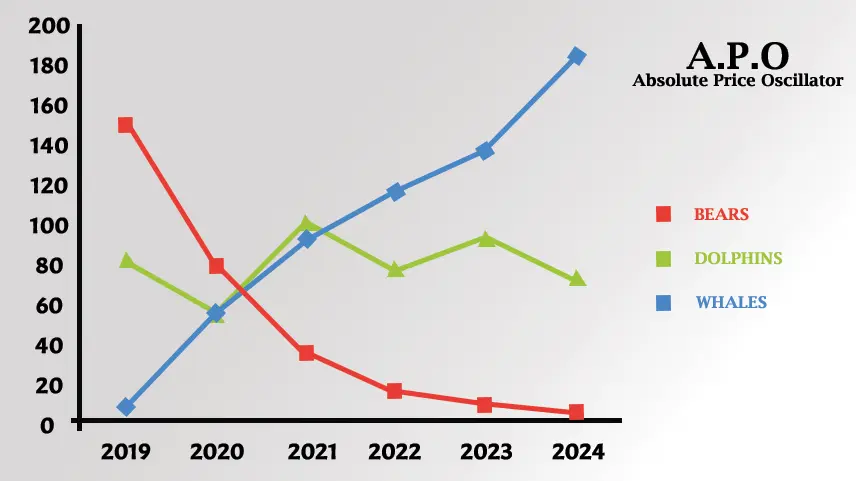
Absolute Price Oscillator: Define, Calculation, works, and Conclusion
What is the Absolute Price Oscillator
The Absolute Price Oscillator (APO) is the technical analysis tool used to buy traders to measure the difference between two moving averages of price. It’s an analysis tool used by traders and analysts to measure the momentum of financial asset prices. It’s like other oscillators like moving average convergence divergence (MACD) but uses absolute price values rather than percentage changes.

APO Calculated
The APO Absolute Price Oscillator involves determining the difference between two moving averages (EMAs) of the price.
APO=EMA (Price, Shorter_Period) −EMA (Price, longer_ Period)
- EMA: Stands for Exponential Moving Average.
- Price: Refers to the closing price of the asset.
- Shorter_Period and Longer_ Period: Represent the time periods for the shorter and longer EMAs, respectively.
APO Application in Trading
1. Traders use the APO to confirm the direction of the trend. A rising APO indicates bullish momentum, while the falling APO suggests bearish momentum.
2. APO crossovers, particularly those above or below the zero line, are used as the signals to enter or exit trades.
3. Divergence Analysis between the APO absolute price oscillator indicator and price movements can signal trend reversal. Bullish occurs price make lower lows while the APO forms higher lows suggesting weaking bearish momentum and the potential reversal to the upside.
4. Traders can customize the parameter of the APO to suit their trading preferences and adapt to different market conditions, shorter periods result in a more responsive APO, suitable for capturing short term trends.
5. APO can provide clues about the volatility of the assets price movements. The rapid increase or decrease in the APO suggests heightened volatility, indicating opportunities for quick traders, or adjustment to risk management strategies.

APO Indicator Works
1. Calculation of EMA’s APO involves computing two exponential moving averages (EMAs) of the assets price data. Moving Averages places weight on recent data points, making it more responsive to changes in price.
2. Once the EMA’s are calculated the next step is to find the difference between them, the shorter-term EMA (with a smaller time) This calculation results in the single line representing the difference between the two moving averages, known as the APO “Absolute Price Oscillator.”
3. Zero-line crossing is APO analysis. When the APO crosses above the zero line, it signals a bullish crossover, indicating that in the shorter term, EMA has crossed above the longer-term EMA, implying upward momentum.
4. Signal Generation Trader use APO Crossover and the direction of the APO line relative to the zero line to get generated buy or sell signals. APO Bullish crossover (APO crossing above zero) while a bearish crossover may signal potential short selling opportunities.
5. Traders analyze divergences between the APO and price movements, APO forms higher lows, signaling weaking bearish momentum and the potential trend reversal to the upside.
Conclusion
APO “Absolute Price Oscillator” provides traders with the powerful tool for analyzing momentum in asset prices, by comparing two exponential Moving Averages (EMA’s) APO Offers insight into bullish and bearish trends, generates buy or sell signals through zero-line crossing, and enables analysis for anticipating trend reversal, with its simplicity and the effectiveness. APO empowers traders to make informed decisions and navigate financial markets with confidence.
0 comments